
World Largest Economies Growth Since 2000: Who Grew Fastest and Why?
Estimated reading time: 8 minutes
Key Takeaways
- The world economy saw an incredible 240% nominal GDP growth from 2000 to an estimated 2025. (https://brilliantmaps.com/gdp-2000-vs-2025/)
- Some economies experienced explosive growth, far exceeding the global average, demonstrating a significant reshuffling of global economic power.
- China’s rapid ascent, Vietnam’s manufacturing boom, Poland’s EU integration, Chile’s commodity strength, and Israel’s tech innovation are highlighted as key growth stories.
- Key drivers included the rise of emerging markets, globalization, the impact of the 2008 financial crisis, commodity cycles, and technological transformation.
- Future growth will likely be influenced by demographics, technological advancements, geopolitical factors, and policy choices.
Table of contents
- World Largest Economies Growth Since 2000: Who Grew Fastest and Why?
- Key Takeaways
- Understanding the 50 Largest Economies: Defining the Giants
- Who Grew the Fastest? Growth Leaders
- Largest Economies Growth Comparison Since 2000
- What Fueled the Growth? Trends & Drivers
- Implications & Future Outlook
- The Evolving Economic Landscape
Understanding the 50 Largest Economies: Defining the Giants
Before we dive into who grew fastest, it’s important to understand how we define the “50 largest economies.” When we talk about these economic giants, we are referring to countries with the highest total value of goods and services produced within their borders.
The list of the world’s 50 largest economies is based on their nominal GDP measured in millions of US dollars. This calculation uses official exchange rates, which means we convert each country’s local currency GDP into US dollars at the market rate. It’s also important to note that these figures are *not* inflation-adjusted. This means the numbers reflect the raw dollar value at the time, not accounting for changes in purchasing power over the years. (https://brilliantmaps.com/gdp-2000-vs-2025/)
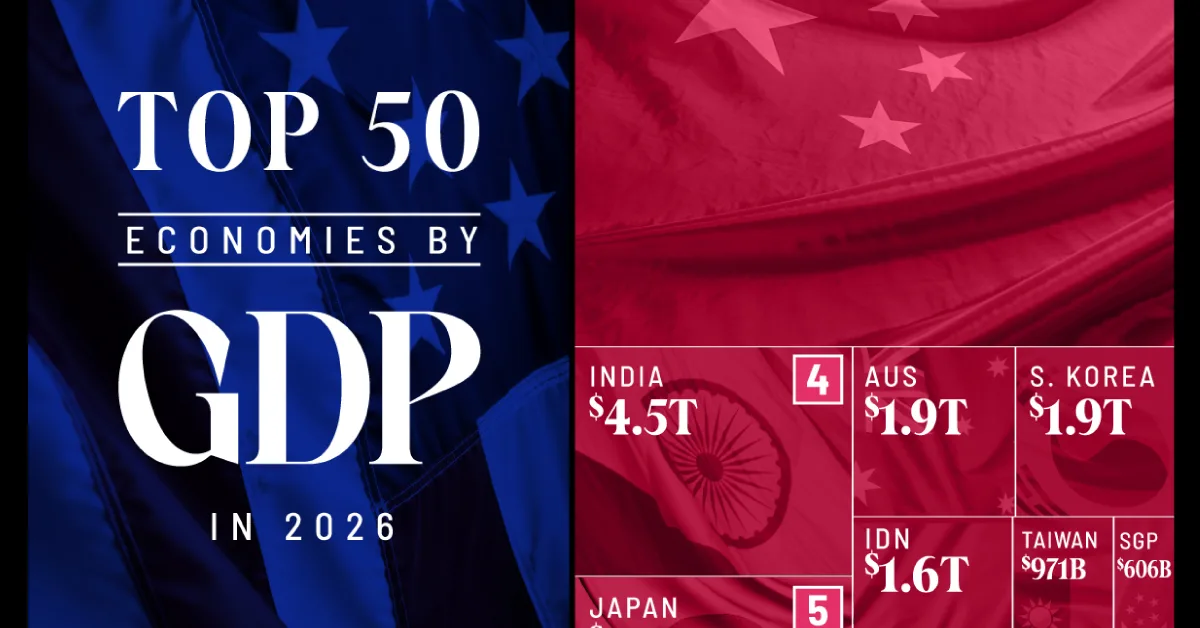
For example, looking at 2025 projections, the very top economies illustrate this scale:
- United States: Expected to reach $30.62 trillion.
- China: Projected at $19.4 trillion.
- Germany: Anticipated to hit $5.01 trillion.
- Japan: Estimated at $4.28 trillion.
- India: Showing significant growth to become a major player. (https://www.statista.com/statistics/268173/countries-with-the-largest-gross-domestic-product-gdp/)
Tracking the economic growth 50 largest economies post 2000 is crucial. It gives us vital clues about global power shifts, trade relationships, and future investment opportunities. Observing the largest economies growth comparison since 2000 helps us identify which countries are ascending and which are facing challenges. It also provides insight into the 50 largest economies growth rate 2000 to present, highlighting areas of strong economic performance and areas of slower expansion. These dynamics are key to understanding the overall world economies growth since year 2000.
Who Grew the Fastest? Growth Leaders
The period from 2000 to 2025 has seen some truly astonishing economic transformations among the world’s largest economies. While global GDP expanded by about 240%, some nations far exceeded this average, rewriting the global economic map. Let’s look at some of the standout performers and the key factors behind their incredible journeys. We’ll explore the list of 50 largest economies growth since 2000 and highlight the fastest growing largest economies since 2000.
Here are some of the most impressive stories of economic acceleration:
* China: The Economic Colossus Rises
China’s economic surge is arguably the most dramatic story of the past 25 years. In 2000, China’s economy was similar in size to Italy’s. However, by 2025, China’s GDP is projected to be nearly *eight times* larger than Italy’s, even though Italy’s own economy more than doubled in the same period. This highlights the truly monumental scale of China’s expansion. (https://brilliantmaps.com/gdp-2000-vs-2025/)
This staggering growth was driven by a powerful combination of factors: massive state-directed industrial policy, huge investments in infrastructure, a large and relatively low-cost workforce, and a strong focus on export-led manufacturing. China’s average annual real growth rate between 2012 and 2025 was approximately 5.93%, showcasing its sustained economic momentum. (https://en.wikipedia.org/wiki/List_of_countries_by_real_GDP_growth_rate) Its ascent has fundamentally reshaped global trade and economic influence.
* Vietnam: Southeast Asia’s Dynamo
Vietnam stands out as a true emerging market success story, showing one of the highest percentage nominal GDP growth rates. Its economy experienced an astounding 1,179% nominal growth between 2000 and 2025. (https://brilliantmaps.com/gdp-2000-vs-2025/)
This explosive growth was largely fueled by a vibrant export-manufacturing boom. Vietnam successfully attracted foreign direct investment, leveraging its competitive labor costs and strategic location to become a key player in global supply chains. A young, growing population (often called a “demographic dividend”) also provided a strong workforce, contributing significantly to its rapid economic expansion.
* Poland: European Integration and Reform
In Europe, Poland emerged as an unexpected leader in economic development. Between 2000 and 2025, Poland achieved an impressive 433% nominal growth in its GDP. This remarkable performance allowed Poland to overtake Sweden, a traditionally stronger economy. In 2000, Sweden’s economy was over 50% larger than Poland’s; by 2025, Poland’s economy is projected to be 43% *larger* than Sweden’s. This is a complete reversal of fortunes, demonstrating Poland’s incredible economic dynamism. (https://brilliantmaps.com/gdp-2000-vs-2025/)
Poland’s success is often attributed to its smooth integration into the European Union. EU membership brought significant investment, access to a vast single market, and encouraged crucial institutional and economic reforms. These factors created a stable and attractive environment for businesses, driving sustained economic prosperity and development.
* Chile: South America’s Steady Performer
Chile, a nation in South America, also demonstrated robust economic growth, recording a 363% nominal growth from 2000 to 2025. This placed its economic expansion well above the global average of approximately 240%. (https://brilliantmaps.com/gdp-2000-vs-2025/)
Chile’s growth has been underpinned by its strong commodity exports, particularly copper, combined with sound macroeconomic policies and a relatively open trade environment. Its commitment to free markets and international trade has allowed it to capitalize on global demand for its resources, fostering significant economic advancement and prosperity.
* Israel: A Hub of Innovation
Israel’s economy has also shown remarkable strength and resilience. During this period, Israel’s technology-driven growth allowed its GDP to surpass that of Iran. This is a significant achievement, especially when considering that Iran posted one of the lowest growth rates globally in the same timeframe. (https://brilliantmaps.com/gdp-2000-vs-2025/)
Israel’s economic success is largely due to its thriving high-tech sector, often referred to as “Silicon Wadi.” Strong investment in research and development, a highly skilled workforce, and a culture of innovation have made Israel a world leader in cybersecurity, biotechnology, and software. This focus on advanced industries has propelled its economic prosperity, differentiating it from economies reliant on traditional sectors.
In summary, the top tier of top economies by growth since 2000 experienced nominal GDP expansions ranging from over 300% to more than 1,000% between 2000 and 2025. This clearly illustrates how fast have largest economies grown since 2000 when they combine strategic planning, favorable external conditions, and sustained internal reforms. These rapid accelerations transformed their positions on the world stage.
Largest Economies Growth Comparison Since 2000
To fully understand the global economic landscape, it’s helpful to compare the growth performances of all 50 largest economies. This largest economies growth comparison since 2000 reveals distinct patterns and helps us categorize countries based on their economic acceleration.
Our comparison methodology uses the nominal GDP growth percentages from 2000 to 2025 for all 50 economies. This allows us to see how much each economy has expanded in dollar terms over this quarter-century. We can then sort these nations into three broad growth brackets:
- Rapid Accelerators (>300% growth): These are the economies that experienced explosive expansion, far outpacing the global average. They fundamentally shifted their positions in the world economy.
- Steady Moderate Growers (150-300% growth): This group includes economies that maintained healthy and consistent expansion, often in line with or slightly above the global average, reflecting stable development.
- Slower Performers (<150% growth): These economies grew at a slower pace, often due to maturity, specific domestic challenges, or external shocks, and generally lagged behind the global average growth.
Imagine a colorful map or a stacked bar chart showing these categories. You would see distinct regional patterns emerging:
- Asia-Pacific Dominance: This region clearly leads the charge in the “Rapid Accelerators” bracket. Countries like China and Vietnam are prime examples of this incredible economic dynamism. Their growth is a testament to strategic economic planning, export orientation, and large, productive workforces.
- Eastern European Momentum: In Europe, nations like Poland stand out as rapid accelerators. Their strong performance often stems from post-communist reforms, economic liberalization, and the significant boost received from integration into the European Union. This contrasts sharply with some older Western European economies.
- Latin American Mix: Latin America presents a more varied picture. Chile, for instance, falls into the “Rapid Accelerators” category, driven by commodity exports and stable policies. However, other major Latin American economies show more moderate growth. For example, Colombia saw an average annual real growth of 2.89% from 2012-2025, while Mexico had a more subdued 1.32% average annual growth during the same period. (https://en.wikipedia.org/wiki/List_of_countries_by_real_GDP_growth_rate)
- Middle Eastern Contrasts: The Middle East offers a stark example of diverging fortunes. Israel, with its thriving technology sector, emerged as a rapid accelerator. In sharp contrast, Iran, facing significant international sanctions and political instability, posted one of the lowest growth rates globally among the 50 largest economies, putting it firmly in the “Slower Performers” bracket. (https://brilliantmaps.com/gdp-2000-vs-2025/)
Illustrative data points further solidify these patterns:
- Rapid Accelerators: Vietnam (1,179% nominal growth), China (estimated >800% growth), Poland (433% growth), and Chile (363% growth) exemplify this group. (https://brilliantmaps.com/gdp-2000-vs-2025/)
- Steady Moderate Growers: Many mature Western European economies and some Latin American nations fall here. While healthy, their growth rates generally stayed within the 150-300% range, reflecting more stable but less explosive expansion.
- Slower Performers: Japan, for instance, experienced an average annual real growth rate of only 0.62% between 2012-2025, placing it in this category due to demographic challenges and mature economic structures. (https://en.wikipedia.org/wiki/List_of_countries_by_real_GDP_growth_rate)
This detailed largest economies growth comparison since 2000 highlights not just individual country performances but also major trends in largest economies growth since 2000. It shows how different regions and economic models led to varying levels of economic prosperity and development, defining the economic growth of world’s 50 largest countries since 2000.
What Fueled the Growth? Trends & Drivers
The dramatic shifts in global economic power since the year 2000 didn’t happen by accident. Several major trends and key drivers were at play, shaping the trends in largest economies growth since 2000. Understanding these forces is crucial to explaining the diverse performances of the world’s largest economies.
Trend 1 – The Rise of Emerging Markets
Perhaps the most defining trend of this era was the meteoric ascent of emerging markets. These economies, predominantly in Asia but also in Eastern Europe and parts of Latin America, capitalized on global opportunities.
- China’s state-directed industrial policy transformed it into the “world’s factory,” with massive government-backed investment in manufacturing, infrastructure, and technology. This central planning and robust execution allowed for unparalleled industrial expansion.
- Vietnam’s low-cost labor became a magnet for foreign investment, allowing it to integrate into global supply chains and become a major exporter. Its demographic dividend, a large and relatively young workforce, also played a crucial role.
- Poland’s EU integration provided access to a vast single market, significant structural funds, and a framework for institutional reforms, driving its economic modernization and rapid development.
These examples collectively illustrate the broader emerging market surge, a phenomenon where developing nations leveraged their resources and strategic advantages to achieve rapid economic growth of world’s 50 largest countries since 2000. (https://brilliantmaps.com/gdp-2000-vs-2025/)
Trend 2 – Globalization & Trade Integration
The first decade of the millennium (2000-2008) saw an unprecedented wave of globalization and trade liberalization. Barriers to trade were reduced, and countries became more interconnected through complex global supply chains.
- Export-oriented economies, especially in Asia like China and Vietnam, benefited immensely. They integrated deeply into global manufacturing networks, producing goods for consumers worldwide.
- Economies like Poland also gained significantly from increased access to international markets and the free flow of goods, services, and capital facilitated by globalization. This period created a virtuous cycle of trade, investment, and economic expansion.
Trend 3 – The 2008 Financial Crisis
The global financial crisis of 2008 and the subsequent “Great Recession” marked a significant turning point for many large economies. The crisis led to a sharp contraction in economic activity worldwide.
- Real GDP growth data shows severe downturns in 2009-2010. For instance, Mexico experienced a dramatic -8.35% year-over-year drop in its real GDP during this period. (https://en.wikipedia.org/wiki/List_of_countries_by_real_GDP_growth_rate)
- The recovery paths diverged significantly. Some economies, particularly in Asia, bounced back relatively quickly due to strong domestic demand and government stimulus. Others, especially in the developed West, faced prolonged periods of slow growth and austerity as they grappled with debt and structural issues. This crisis fundamentally altered future economic trajectories and investment patterns.
Trend 4 – Commodity Cycles
For resource-rich economies, commodity prices played a huge role in their economic performance.
- Nations heavily dependent on oil, minerals, or agricultural exports (like Saudi Arabia or Russia) experienced volatile growth. When commodity prices were high, these economies boomed. However, sudden drops in prices could lead to sharp contractions and economic instability.
- This reliance on primary commodities often contrasted with more diversified economies, which could weather price fluctuations better due to multiple sources of income and production. The world economies growth since year 2000 for these nations was often a roller coaster.
Trend 5 – Technological Transformation
Technological advancement was a powerful, albeit uneven, driver of growth across different countries.
- Israel serves as a prime case study for technology-driven growth. Its high-tech boom, fueled by innovation, venture capital, and a skilled workforce, propelled its economy forward, creating high-value industries.
- In contrast, some highly developed nations struggled to adapt. Japan, for example, known for its technological prowess, saw a low average annual real growth rate of just 0.62% between 2012 and 2025. This highlights how even technologically advanced economies can face challenges like aging populations and structural rigidities that slow overall economic expansion. (https://en.wikipedia.org/wiki/List_of_countries_by_real_GDP_growth_rate)
These diverse trends, from the embrace of globalization to the impact of financial crises and the march of technology, paint a complex picture of the forces that shaped the economic growth of world’s 50 largest countries since 2000.
Implications & Future Outlook
The past 25 years have been a period of profound change, underscoring that the world largest economies growth since 2000 has been remarkably uneven. This unevenness is the central takeaway: while the global economy expanded significantly, a few rapid accelerators fundamentally reshaped the global hierarchy of economic power. Traditional economic giants faced new competition from dynamic emerging markets.
The global average nominal growth of roughly 240% over this period serves as an important benchmark. It highlights that while some economies soared far above this, many large economies, especially mature developed nations, lagged behind. This divergence has created new challenges and opportunities for policymakers and investors alike. The economic landscape is no longer dominated by a select few, but rather by a more diverse and competitive set of players.
Looking ahead, we can anticipate several potential future scenarios that will continue to shift these rankings:
- Demographic Slowdown in China: While China has been a growth leader, its aging population and shrinking workforce could impact its future growth trajectory. This means China may need to rely more on innovation and domestic consumption rather than just export-led manufacturing.
- Continued Tech Leadership: Economies like Israel are likely to maintain their leadership in technology and innovation. Their ability to foster high-value industries will be critical for sustained prosperity and competitiveness. We may see more nations adopting similar innovation-centric strategies.
- Resurgence of EU-Integrated Economies: Eastern European nations that have successfully integrated into the EU, like Poland, may continue to experience robust growth, albeit at a more moderate pace. Their access to the single market and ongoing structural reforms could sustain their economic momentum.
- Impact of Geopolitics and Trade Policy: Future trade policies, geopolitical tensions, and regional conflicts will undoubtedly play a significant role. Nations that adapt to these challenges and maintain stable international relationships may have an edge.
Policymakers and investors must closely watch several key factors to navigate this evolving landscape. These include shifts in global trade policies, the pace of technology adoption and digital transformation, the effectiveness of institutional reforms, and how countries manage demographic changes. Understanding these underlying currents is crucial for making informed decisions about economic development and investment in the decades to come.
The Evolving Economic Landscape
In reviewing the world largest economies growth since 2000, the data clearly show that the global economic landscape has undergone a monumental transformation. From the dramatic ascent of China and Vietnam to the surprising dynamism of Poland and the technological prowess of Israel, the story of the past 25 years is one of remarkable change and divergent growth paths.
We’ve seen that while global GDP expanded by nearly 240%, the fastest-growing large economies achieved nominal growth rates exceeding 300%, and in some cases, over 1000%. These impressive feats were driven by a mix of factors: strategic industrial policies, export-led manufacturing, strong institutional reforms, regional integration, and focused technological innovation. In contrast, other economies, often mature or commodity-dependent, experienced slower expansion due to various internal and external pressures.
The economic growth of world’s 50 largest countries since 2000 has fundamentally altered global power dynamics, creating a more multipolar economic world. The hierarchy of nations is no longer static. The lessons learned from these growth leaders are invaluable for any country striving for prosperity.
The next decade will undoubtedly bring further shifts in these rankings, driven by ongoing technological revolutions, evolving geopolitical landscapes, and varying national policy choices. The world largest economies growth since 2000 has set a new precedent for dynamism and change, ensuring that the global economic journey remains one of the most compelling stories of our time.
Frequently Asked Questions
Q: What is nominal GDP and why is it important for measuring economic growth?
A: Nominal GDP measures the total value of goods and services produced in a country at current market prices. It’s important because it shows the absolute dollar value increase of an economy, reflecting its scale and economic activity in the global market. For comparing growth over time and between countries, it provides a clear, if not inflation-adjusted, picture of expansion.
Q: Are emerging markets always the fastest growers?
While many of the fastest-growing economies in recent decades have been emerging markets, it’s not a universal rule. Their growth often stems from a lower base, rapid industrialization, and integration into global trade. Mature economies can also achieve significant growth through innovation and productivity gains, though their percentage growth rates might be lower due to their larger economic size.
Q: How did the 2008 financial crisis impact the growth of large economies?
The 2008 financial crisis caused a global economic downturn, with many large economies experiencing sharp contractions in GDP. The recovery process was uneven. Some nations, particularly those with strong domestic demand and effective stimulus measures, recovered faster than others, which faced prolonged periods of slow growth due to debt burdens and structural challenges. The crisis highlighted the interconnectedness of the global economy and the vulnerability to financial shocks.
Q: What is the significance of technological innovation for economic growth?
Technological innovation is a crucial driver of economic growth, especially in developed and rapidly developing economies. It enables increased productivity, the creation of new industries, and higher-value jobs. Countries that invest heavily in research and development and foster an environment for innovation, like Israel, often see sustained, high-quality economic growth.
Q: How can geopolitical factors affect the growth of the world’s largest economies?
Geopolitical factors, such as trade wars, regional conflicts, and international relations, can significantly impact economic growth. They can disrupt supply chains, affect trade flows, influence investment decisions, and create economic uncertainty. Nations that maintain stable geopolitical relationships and adapt to shifting global dynamics are generally better positioned for sustained economic prosperity.